Winter 2016-2017 Preview Connecticut Hudson Valley
Winter 2016-2017 Preview Connecticut Hudson Valley

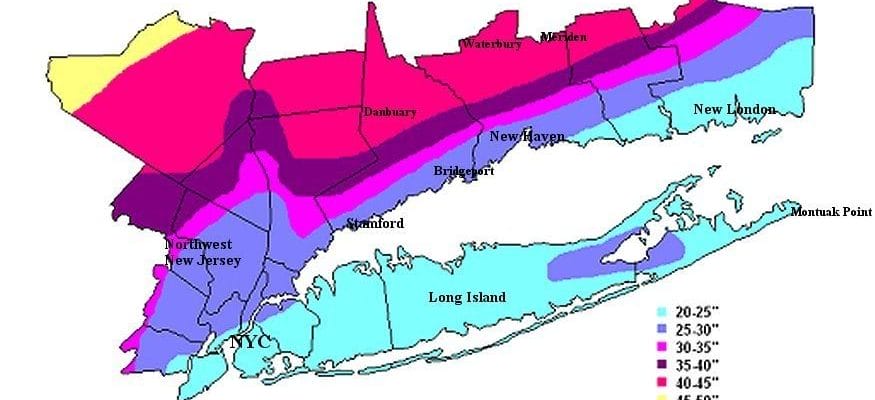
As we look ahead to the upcoming Winter 2016-2017 we take a look at the Hudson Valley & Connecticut. These seasonal snowfall averages should be used with caution because it is my contention that the normals are not accurate for Long Island and Coastal Connecticut and should be at least 5 to 10 inches higher. Over the last 10-15 years with the addition of reporting stations in between the main stations, we have seen the emergence of many micro climates that enhance snowfall higher. For example in Southern Connecticut there is a hole that exists between Bridgeport and New London where averages actually should be lower than the areas on either side. This is due to the fact that many times the area in between misses out on coastal intensification that sometimes buries Central and Eastern Long Island and from Rhode Island eastward, but misses Southeastern Connecticut. In the Hudson Valley snowfall is usually enhanced by the east facing hills of Rockland, Orange, and Sullivan Counties where amounts can also be higher.
We also have the general trend of the last 15 or so winters where the coast has seen more snow than inland areas. Last year was a perfect example of this as the snowfall deficits from normal were far higher as you went north. Also there are errors on this map where coastal areas of Long Island should be showing a surplus of snowfall as many areas near the coast finished with 40-50 inches for the season. However the inland area stats are correct. Thanks to the Blizzard 2016 it brought the snowfall totals up in southern areas whiel areas to the north including the Hudson Valley and Connecticut showed snowfall deficits of 20-30 inches or more from normal.
There are some things about this coming winter that at the moment are nagging at me. The first is the persistent drought that continues and there seems to be no signs of that pattern changing in the next few weeks. Granted that October is the driest month of the year so it is playing to form according to the season. However at some point we need to see that pattern flip. There is nothing that says that the winter can’t be cold dry and snowless.

The second thing that is bothersome to me and it is tied to the drought pattern is the persistent ridge in the east that shows no signs of breaking down. It keeps popping up time after time and until that breaks down, we can’t even begin to confidently forecast anything in the medium and longer term much less the entire winter.
WINTER 2016-2017 SIBERIAN SNOW COVER UPDATE
We are half way through the month of October so we will now take a look at the state of Siberian snow cover. The rate of snow cover growth is tied (theorectically) to snowy winters in the east. The faster the rate of growth in the area south of 60 degrees north latitude is what matters with a focus on eastern areas vs the west.
SIBERIAN SNOW COVER RATE OF GROWTH COURTESY OF FRONTIER WEATHER
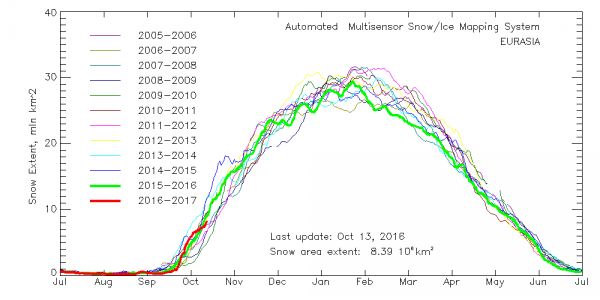
The red line is growth so far which is running around the middle of the range. It is behind last year when the indicator failed. Last year it finished near the top of the range of the last 11 winters but as we know the super El Nino trumped it all. We need to see where it is at the end of the month. That is where it matters.

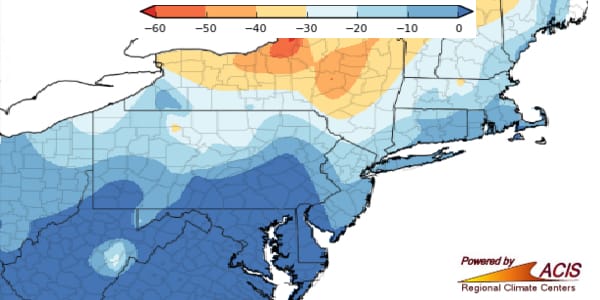
We have seen some growth over the last 5 days south of 60 degrees north. As for the next 10 days here is the GFS forecast snowfall for Eurasia through October 26th.

MANY THANKS TO TROPICAL TIDBITS FOR THE WONDERFUL USE OF THE MAPS

MENTION JOE CIOFFI AND GET A 5% DISCOUNT
WINTER 2016-2017 PART 1 OCEAN WATER TEMPERATURES
WINTER 2016-2017 PART 2 ARCTIC SEA ICE AND SIBERIAN SNOW COVER
FiOS1 News Weather Forecast For Long Island
FiOS1 News Weather Forecast For New Jersey
FiOS1 News Weather Forecast For Hudson Valley
NATIONAL WEATHER SERVICE SNOW FORECASTS
LATEST JOESTRADAMUS ON THE LONG RANGE
Weather App
Don’t be without Meteorologist Joe Cioffi’s weather app. It is really a meteorologist app because you get my forecasts and my analysis and not some automated computer generated forecast based on the GFS model. This is why your app forecast changes every 6 hours. It is model driven with no human input at all. It gives you an icon, a temperature and no insight whatsoever.
It is a complete weather app to suit your forecast needs. All the weather information you need is right on your phone. Android or I-phone, use it to keep track of all the latest weather information and forecasts. This weather app is also free of advertising so you don’t have to worry about security issues with your device. An accurate forecast and no worries that your device is being compromised.
Use it in conjunction with my website and my facebook and twitter and you have complete weather coverage of all the latest weather and the long range outlook. The website has been redone and upgraded. Its easy to use and everything is archived so you can see how well Joe does or doesn’t do when it comes to forecasts and outlooks.
Just click on the google play button or the apple store button on the sidebar for my app which is on My Weather Concierge. Download the app for free. Subscribe to my forecasts on an ad free environment for just 99 cents a month.
Get my forecasts in the palm of your hand for less than the cost of a cup of Joe!
![]()