
JOESTRADAMUS: WINTER FORECAST 2015-2016
I’m going to be honest from the get go here. I am not a fan of these kinds of forecasts. Long range is simply not my strong suit. While I have been reading up and knocking my brains out trying to understand all this, I keep coming back to the short term where there are so many variables that come into play. To ask someone to come up with a 4 month winter forecast outlook (December through March) is a very very tall order. So what I’m going to do is break this down step by step and try to come up with some sort of reasonable conclusion. If you are looking for a forecast that gives dates, start and end times and a snowflake count per square mile within 10 snowflakes, you will be sorely disappointed.
EL NINO
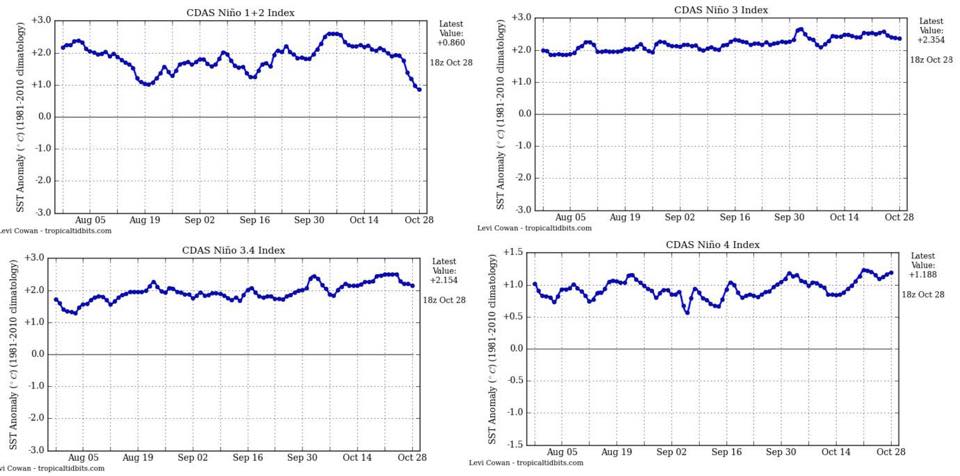
The el nino is the main player that everyone is looking at and focusing on. The contrarian in me wants me to look elsewhere. However it simply can’t be ignored. The 2015-16 El Nino is a powerful force. Standing alone it brings everyone to the winters of 1997-1998 and 2011-2012 which were warm wet and relatively snowless in the east. However this El Nino is different from those El Nino years in a number of ways that I have gone over in previous posts. This El Nino contrary to lazy apocalyptic reporting done from main stream media is not the huge mega Godzilla El Nino of all time.
Recent developments in the water temperature profile are pointing to the fact that the Easternmost area of the El Nino has peaked and has been in decline through the month of October. Past El Nino water temperature profiles have pointed to double peaks. Some argue that we have already had that double peak and that the water temperatures in region 1 (along and off the coast of South America) has hit a double peak. If this trend continues of a water temperature decline in the east this would be a positive for cold and snow lovers. The Central Pacific water temperatures continue to hold just off the highs. The central Pacific based El Nino would mean an active subtropical jet. The weakening Eastern Pacific portion El Nino would mean a weaker ridge along the east coast. So far we have not seen that east coast ridge completely disappear. Right now we would rate the El Nino as a NEGATIVE for a cold and snowy winter overall. However if the El Nino does in fact weaken faster than models forecast than it could become a NEUTRAL factor.
SIBERIAN SNOW COVER GROWTH RATE

This indicator is strongly positive of another cold snowy winter. The index that measures this, after a slow start, accelerated in mid month and it has finished. The index finishes among the top 3 which puts it in line with the last 2 winters. The index has worked well if you use it as a straight correlation. In other words fast growth rates mean cold and snowy winters in the east. Where the index failed last year was that the coldest areas were confined to the northeast and not the entire east coast and midwest. The high index reading last year led some long range forecasters to conclude that a pattern of “blocking” would develop. Blocking in the atmosphere at northern latitudes displaces cold air southward. However this did not occur! The atmosphere found a different way to deliver cold air to the east. We rate this indicator as a POSITIVE for a cold and snowy winter.
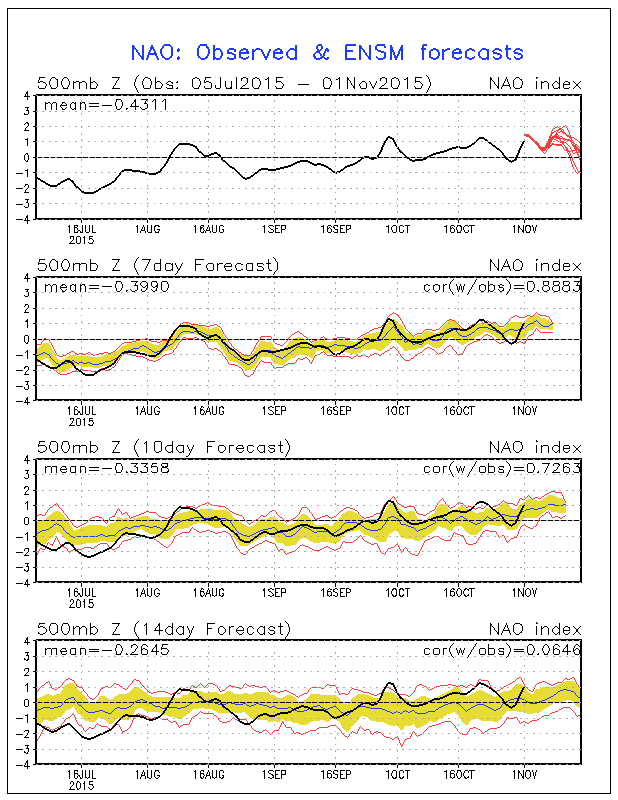
Latest short term models are forecasting to the NAO to go negative later this month. Most of the ensemble members are showing this as of last night. Let’s see if this holds for at least the next few model runs.
NORTH AMERICA SNOW COVER GROWTH
Snow cover growth has been close to normal overall with above normal snow cover growth in Northeastern Canada. This is a reaction to the North Atlantic Oscillation being negative in September through mid October. In the west the growth has been below normal which could be due to the above normal Pacific water temperatures there and a lack of cold air masses coming down into Western Canada so far this winter. I have not seen research that links these factors to harsher winters in the East and Northeast U.S. with regards to Northeast Canada snow growth. I looked back at the data over the past 20 years or so and it seems to be all over the place in both directions with no clear trend. NON FACTOR.
NORTH ATLANTIC OSCILLATION
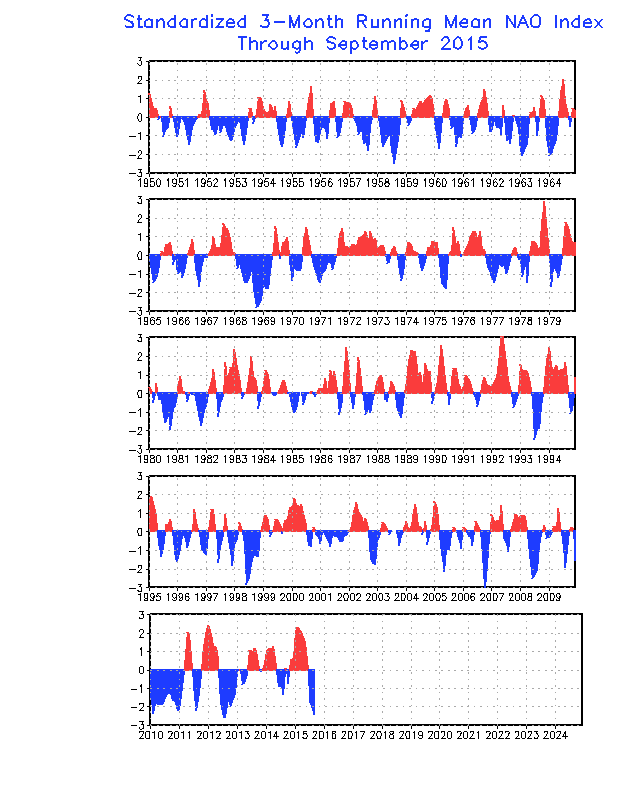
This is the big wild card. The last 3 winters saw the North Atlantic Oscillation as a non factor except in a few isolated instances. What this indicator means is that when the N.A.O. index is negative, we have warming in the atmosphere at northern latitudes. This displaces cold air southward into the Eastern United States. It also tends to create storm log jams in the Atlantic which forces storm tracks further south as cold air lodges in the east and becomes more important. Right now the index is positive after being at record lows during parts of this past summer. This is a very volatile index as it changes over short term ranges of one or 2 weeks or so. Sometimes the index can stay negative for longer periods of time. The oscillation has to be “west” based in the Atlantic or stronger in the Western Atlantic than in the Eastern Atlantic. Being that this is a shorter term indicator it becomes very difficult to manage. Also the indicator was positive most of last winter and it did not seem to make a difference because other factors at play which we will get to shortly. Rating this as a positive or negative for winter cold and snow at this point is very difficult.Being that it has been virtually absent the last 2 winters, it would seem to me that it will probably be more active this winter. The question will be when, where, and for how long. WILD CARD.

NORTHERN PACIFIC SEA SURFACE TEMPERATURES.
The last 2 winters were dictated by this feature. Warmer than normal water temperatuers in the Northern and Northeast Pacific from the Gulf of Alaska to the Coast of Canada created strong upper air ridge conditions there which displaced Arctic air south and east into the United States. The water temperatures there continue to remain above normal. Many long range forecasters are predicting this warm pool to disappear in the next few months. However this remains a persistent feature here and until it disappears it will remain a factor in cold air delivery. We rate this as a moderate POSITIVE for a cold and snowy winter.
CLIMATOLOGY
Specifically for the New York, New Jersey Eastern Pennsylvania and Southern New England we are in a new climatological area. Going back over the last 15 years we have seen 10 of the last 15 winters produce above normal snowfall. This is a reverse of the prior 30 year cycle of 1970-1999 where for New York City and nearby points, 24 of those 30 winters produced below normal snowfall and in general above normal temperatures. Clearly in the year 2000 we have switched to some sort of up cycle as far as snowfall is concerned. 6 of the last 7 winters have produced above normal snowfall. Going back to 1869 in New York City we have never done 7 out of 8. Long Island data is similar though the data set only goes back to the mid 1940s. I also am dubious about some snowfall numbers as there was a period where car tops were used as places to measure and not taking 10 block walks to Central Park. The maps below show the average snowfall for New York New Jersey & Southern Connecticut.

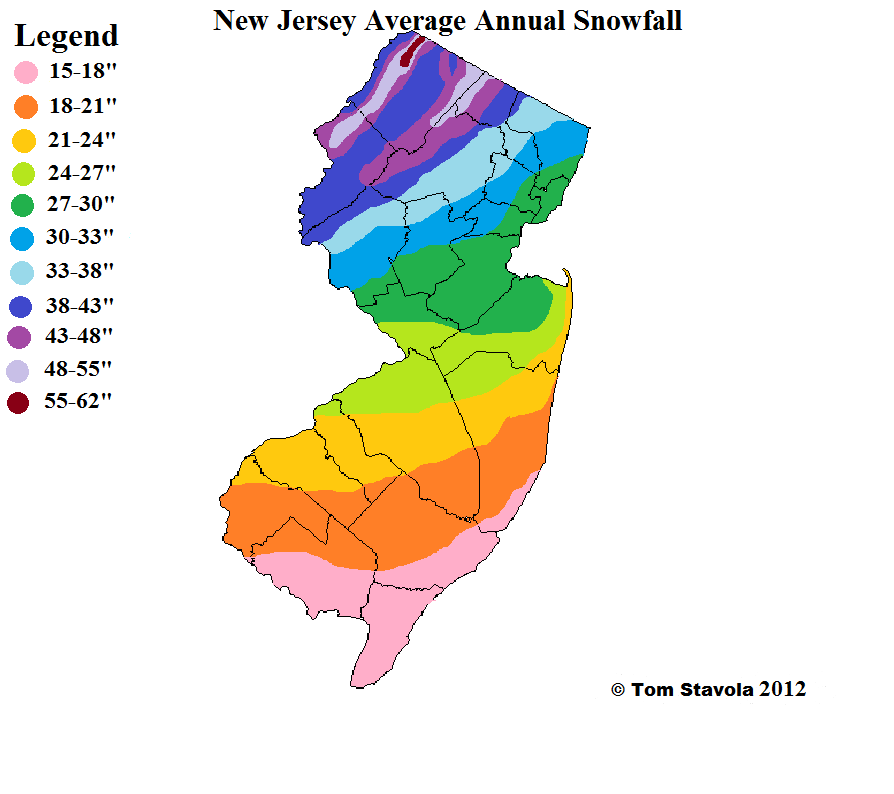
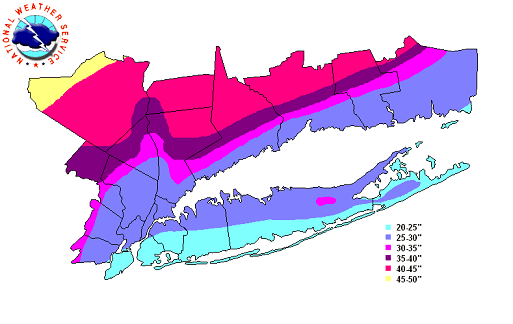
Also for Long Island and some of the smaller airports, they would be closed at night and if it snowed at night, it would not be counted in the snowfall totals. Islip was known for this in the early part of the 2000’s before it went 24-7. So weighing all that in mind the climo-cycle we are are in would favor above normal snowfall. Temperatures are a different story as it is only in recent winters (the last 2) where the temperature variations have become larger as compared to normal. Also ifyou look back over the long term you will find that a vast majority of winters produce snowfall numbers below the average. It is just that the big winters are usually double or more the normal and that skews the average number higher. We rate climatology as a slight POSITIVE for a cold and snowy winter however we are due for a sub par winter. The problem with data sets is you can never have enough data.
MY FORECAST
Okay this is what I am thinking here. I am going to lean toward the idea that the winter will make occasional appearances between now and the end of December. An early snowfall will hinge on whether the N.A.O. goes negative over the last 6 weeks of the year. If it does I think we will get a couple of chances. Otherwise we will have to wait until late December or Early January for the El Nino to weaken enough to allow the other factors to come into play. So I will forecast temperatures to average closer to normal when you net it all out with a bias toward a little below normal. Snowfall will probably be closer to normal and lower than the last 2 winters but well above the El Nino years where snowfall was very low. I also believe that unlike the last 2 winters where the cold patterns were long and unrelenting, I believe there will be more variability this winter with warmer and colder stretches of shorter duration. With regards to “the big one” we know that all it will take is one of those to throw the snowfall forecast completely out the window but I do believe there will be one or two threats that will look like “classic” threats for big events as I expect the N.A.O. to be more of a factor than in past winters. When you look at the past it is natural to expect a sub par winter since most of them actually are in one respect or another. They can’t all be cold with non stop blizzards.
At this point I want to state that there is a high probability that my forecast is going to go wrong somehow on any one or all of these factors. I don’t see the practicality of providing a long range view with some many variables that even those with PHD’s have a difficult time understanding. Sure if you are a natural gas or oil trader you might want to set up trades or perhaps if your business is weather dependent you might want to take some sort of hedging strategies. But for the average person, you have to buy a coat, gloves, and a scarf and maybe chop a little less or a little more firewood. Perhaps you might top off your oil tank before a cold blast. Other than that you are stuck here. It is not as if you are going to sell your house and move for a colder than normal winter. Many of you have been asking me for a winter forecast. I do this kicking and screaming but now you have it. It will be in the archive here for anyone to pull it up and throw it back at me which every way it goes. And yes I will probably update this somewhere along the way because, as I have tried to show over the last year, forecasting is a journey and not a single event. The atmosphere is fluid and constantly changing and the trick is trying to stay ahead of those changes which is extremely difficult to do. As I have said to so many, I have trouble with the next day and sometimes the next hour let alone the next 4 months. If this forecast turns out to work out exactly, it will coincide with the Jets and Giants meeting in the Super Bowl.
For prior articles on the upcoming winter read my past stories regarding this under siberian snow cover and also under winter-2015-2016.
My weather app and forecasts are avaliable for all devices.
LATEST ON TYPHOON IN FA AND ITS EFFECT ON THE LONGER TERM PATTERN
MORE ON THE SHORT RANGE WEATHER FORECAST FOR THURSDAY