
Joestradamus was playing around with the long range maps and noticed something that struck him. What Joestradamus has done is put up the last 3 off model runs (6z,18z). These are what some call the in between runs that occur twice a day. They occur (you guessed it) in between the main model runs that are at 11am and 11pm. What stands out is the complete difference each run shows for the time frames which are 2 weeks from now. It illustrates a number of things, not the least of which is the pointlessness of trying to get anything specific as far as a practical forecast is concerned. So don’t ask! (lol). However there are a few things we can figure out with regards to the longer term.
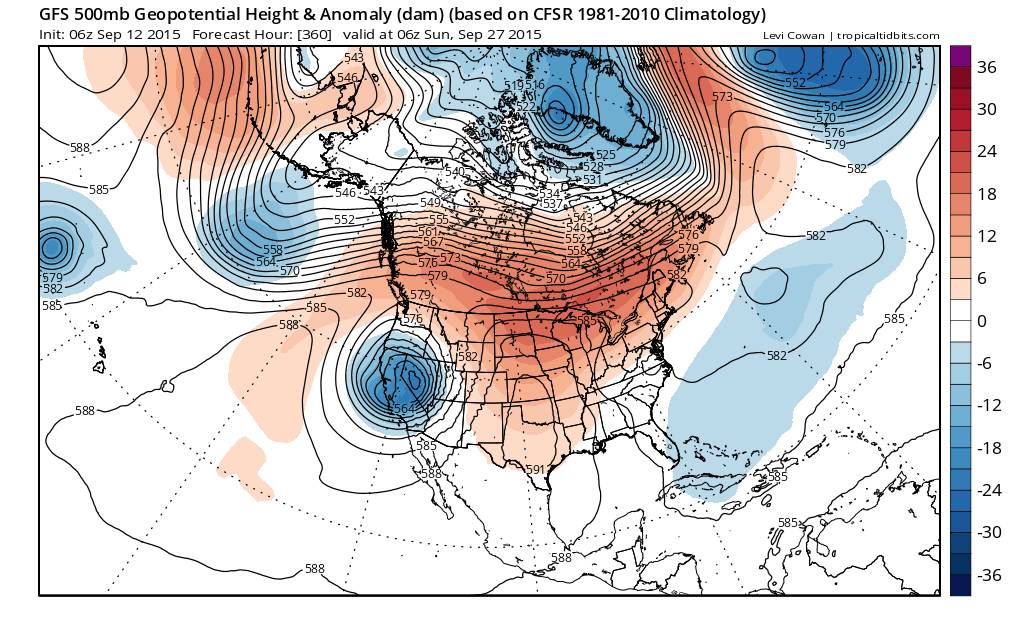
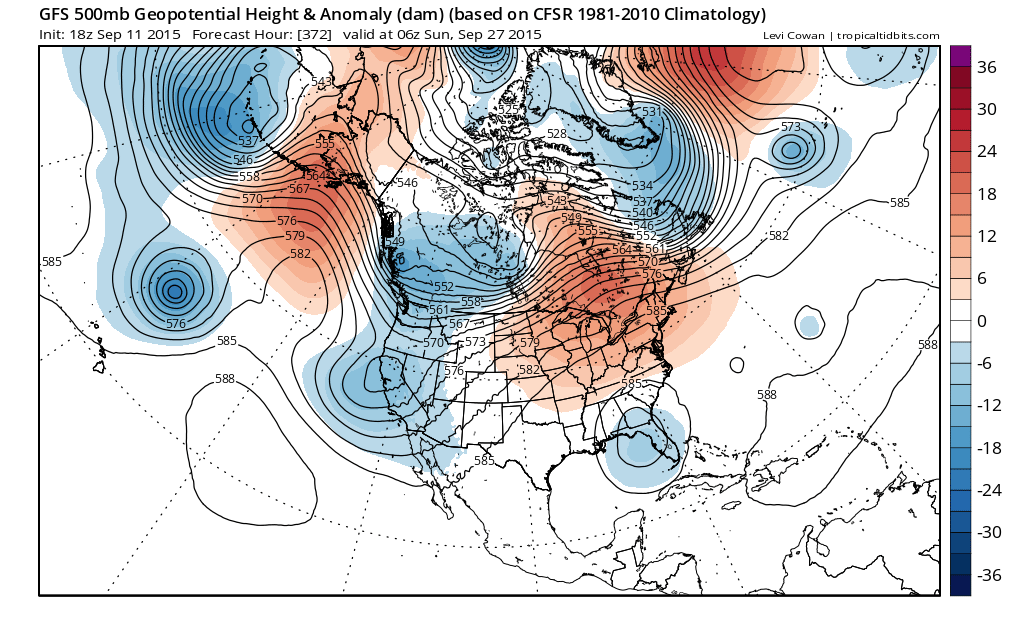
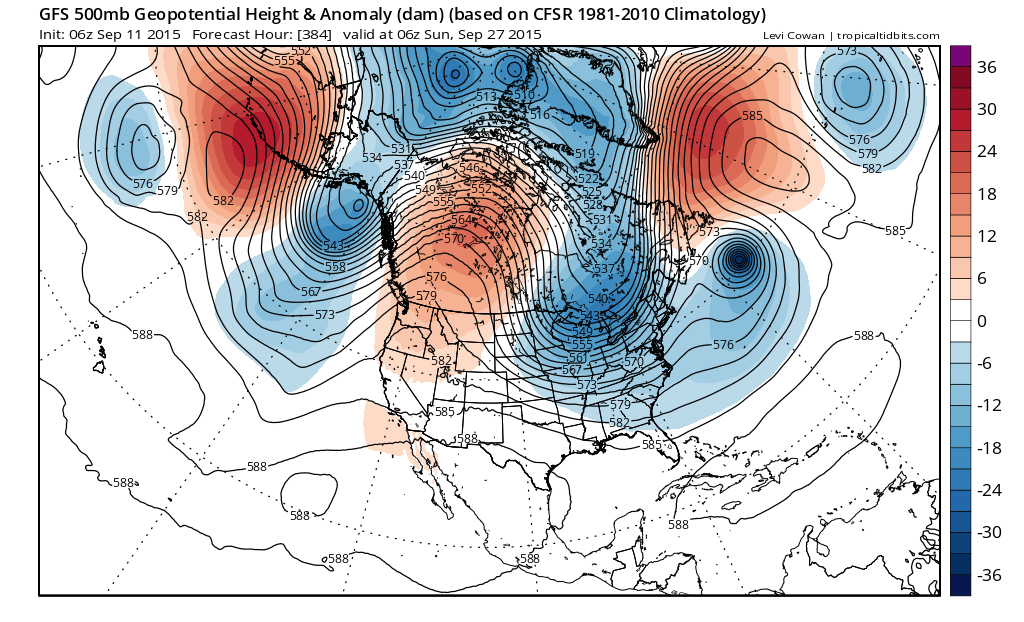
First off the question of the volatility and why? The answer could like in several facots but I think the most important factor is the track of tropical cyclones and their impact on the longer term flow across the northern latitudes. We know for example that re-curving tropical systems in the Pacific can alter and change the strength of ridges and troughs in the northern latitudes which of course feeds down the chain into North America and beyond.
Now with all that said let’s take a look at today’s long range gfs 234 hour (day 16) and the European 240 hour which match up to the same time frame so we can have an apples to apples comparison.
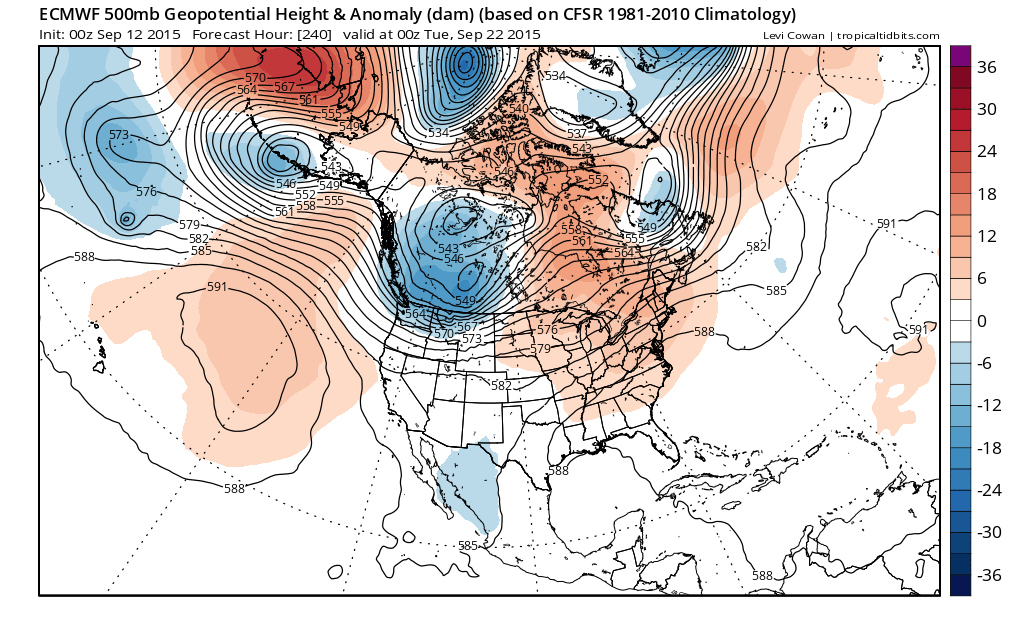
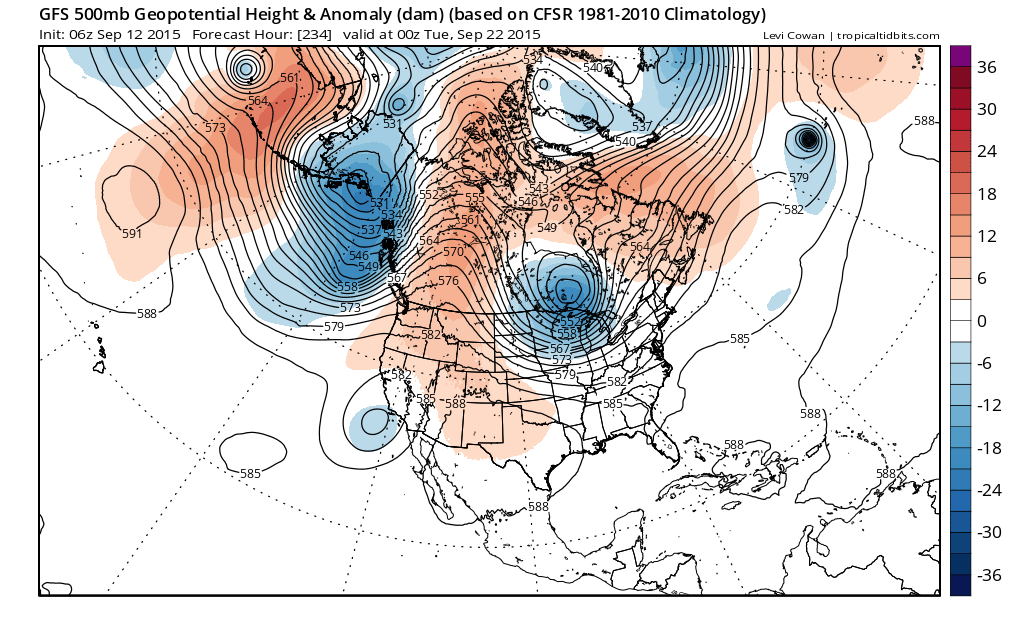 The 2 models are different. Im not going to make a judgement on either on in terms of a specific forecast. The European is showing what is basically the dominate weather pattern we have been in which is ridge in the east, trough in the west. The GFS however seems to see something that creates a trough into the western Great Lakes. In fact it would be similar to what we are experiencing today and Sunday with this deep trough in the eastern states. The gfs is picking up on something that is possibly doing this so what I did was loop the gfs model over the Pacific and it seems that around hour 200 it develops a tropical system of some kind that possibly energizes the low in the Gulf of Alaska which forces a ridge to build in the west which forces a trough to dive in the east. Im not saying that this is right or wrong but you can see the frustration of trying to make sense of things over a long term when things are there one minute and then gone the next.
So knowing all this what do we conclude. Well not much really that is of any real value as far as a day to day forecast. However I think we can say that the overall pattern remains in place regarding a general ridge in the east and trough in the west. Both models depending on what they see at any give time will attempt to carve out occasional troughs in the east. At least this affords opportunities for rain. However those troughs are going to continue to be impacted on whether Pacific tropical systems (if any) recurve and get absorbed by northern latitude extra-tropical cyclones or not. The Atlantic remains dead as a door nail as far as re-curving hurricanes. There haven’t been any. In fact even the weak systems can’t seem to get north of 20N or west of 65W without falling apart. Nothing in the upper air pattern suggests any change here either. The shearing environment in the Atlantic has been unrelenting and overwhelming and no signs of changing there. The Pacific from east to west remains in a favorable el-nino based pattern. When it ain’t broke don’t try to fix it and the trend is your friend. No changes here expected until proven otherwise.
Bottom line is this. The overall trend will be for above or much above normal temperatures in the east, with occasional interruptions dependent on what is going on in the tropical Pacific. The el-nino pattern continues to intensify as we head into October when it is forecast (by some models) to reach its peak. Beyond that we are in what I would refer to as clown land.
If you really want to look at silly maps, and i know most of you do (so do I), here are 2 climate models and the forecasts for temperature departure from normal for the three winter months.

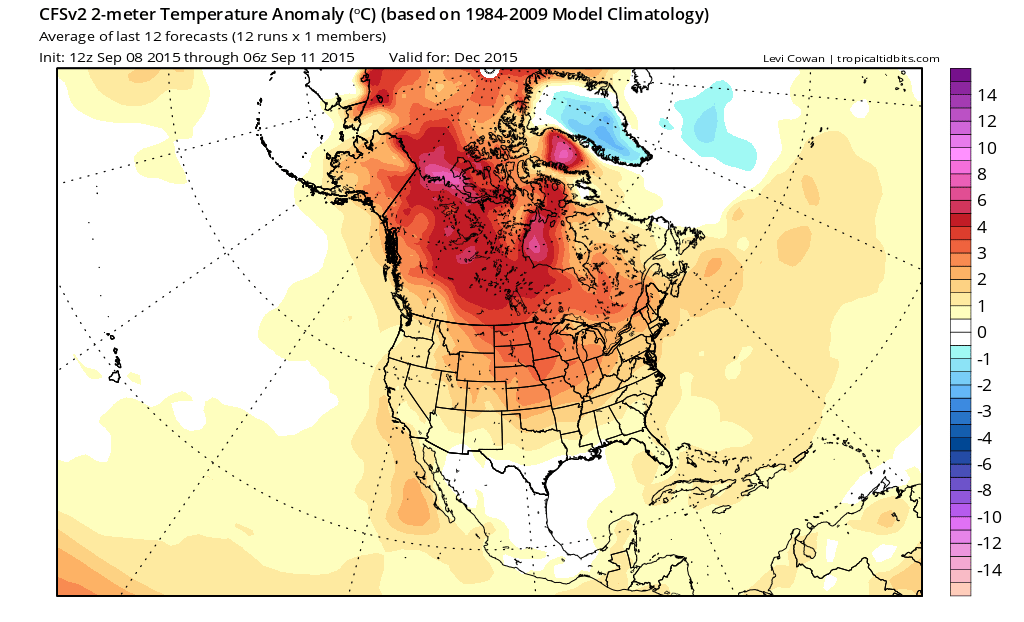
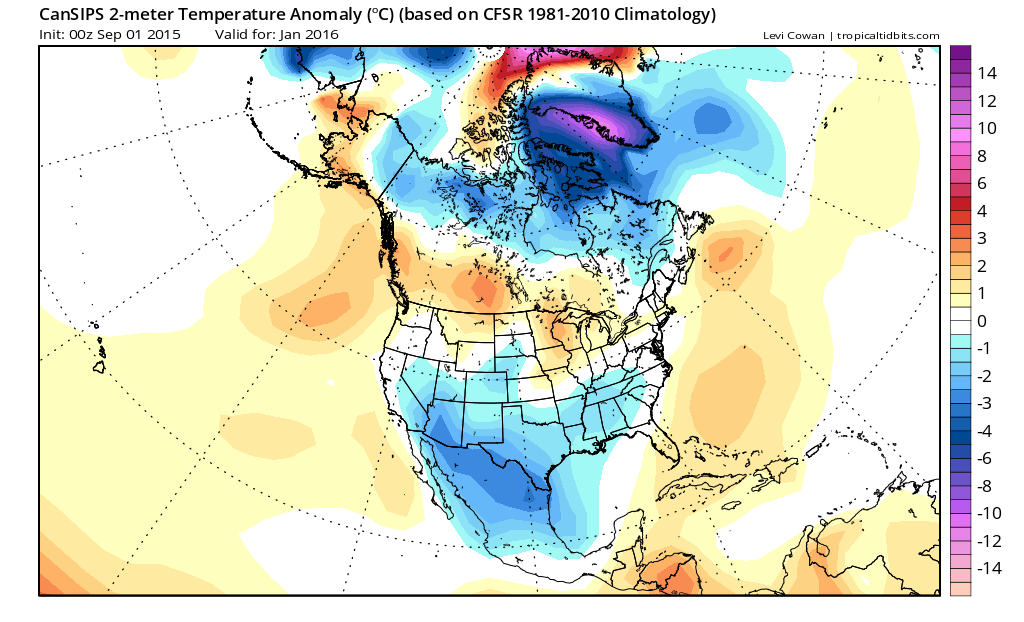
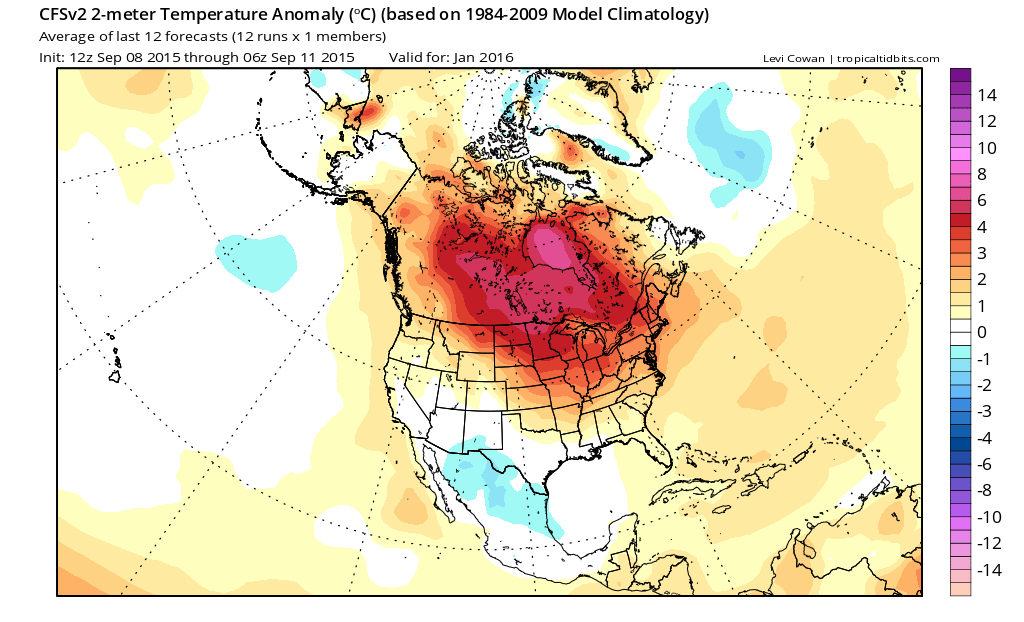
Above is December 2015 and below is January 2016. 2 models, 2 completely different forecasts.
And now we have February
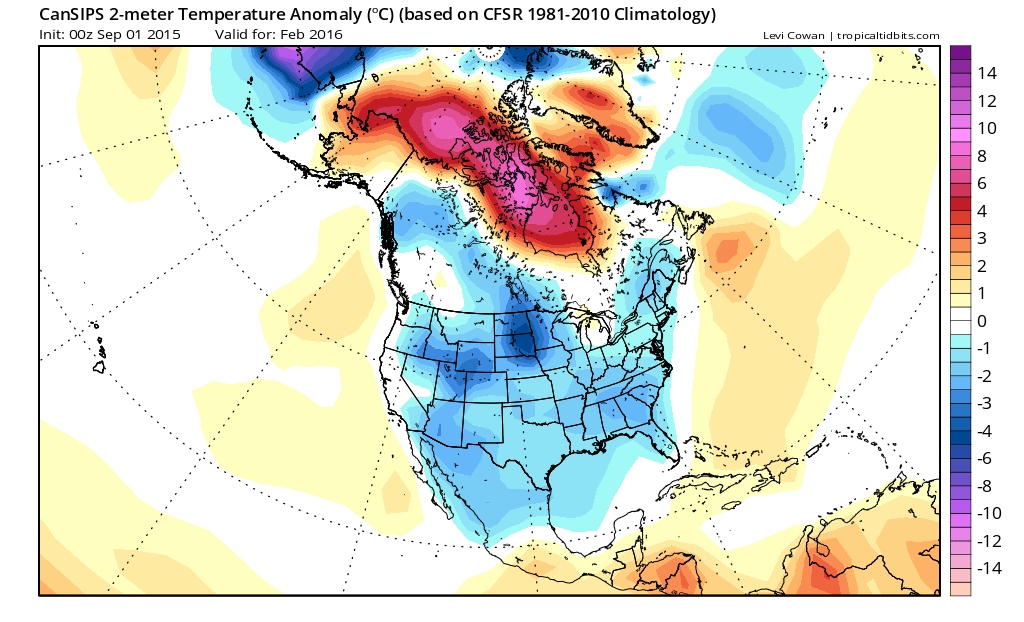
 One model has an above normal winter in the east with an el nino dominated look while the other clearly picks up on something else that might be going on to show a colder than normal winter. The possible factors have been gone over time and again by many with wild cards out there by Joestradamus and by others. No conclusions can be drawn by the pattern we are in now and the pattern we will be in 3 months from now. If we aren’t able to settle the temperature question can we even begin to address the snowfall question? This is why I have a problem with making long range weather forecasts based on the obvious. It is what we don’t know that will make or break any or all of those map forecasts above.
The journey continues and there will be all sorts of twists and turns along the way. Enjoy the ride folks, it is, as always, going to be “FASCINATING!”
BE SURE YOU DOWNLOAD MY WEATHER APP. SUBSCRIBE TO MY FORECASTS FOR JUST 99 CENTS A MONTH..AD FREE..NO SECURITY ISSUES!