
El Nino Update: The Peak Is Reached For Key Areas..Siberian Snow Cover Update
With the key winter indicators being looked at some new developments and trends have emerged that are very important and they will have a big say in the outcome for the coming winter. Weather models that monitor have been forecasting a decline in the strength of the El Nino for a number of weeks now and we see on the graphic below that this is indeed the case. Each panel represents the water temperature anomaly (how much above or below normal) the water temperatures are in key regions
| Niño Region | Range Longitude | Range Latitude |
|---|---|---|
| 1+2 | 90°W-80°W | 10°S-0° |
| 3 | 150°W-90°W | 5°S-5°N |
| 3.4 | 170°W-120°W | 5°S-5°N |
| 4 | 160°E-150°W | 5°S-5°N |
Region 1+2 is the area closes to South America just south of the equator. El Nino’s that are centered in this region tend to be the most disruptive to the normal winter patterns and would favor a 1997-98 or 2011-2012 type winter with very little snow in the east. El Nino’s that are centered further west on the other hand like out near Hawaii or further west tend to favor more active winters if other factors are playing along with it like the Greenland Block (which was not the case the last 2 winters) or the warm waters in the Northeast Pacific (which was the case the last 2 winters).
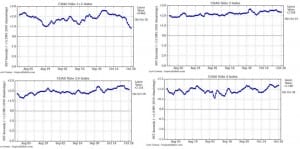
The most important development is that in regions 1+2 we are seeing a sharp declines that have developed in the regions closest to South America. That decline has been especially sharp in the last 2 weeks. The water temperatures there have gone from being 2.5 degrees above normal at the end of September to 1 degree above normal or a change of 1.5 degrees in the anomaly. That is a very big change. The index that is centered much further west in region 4 or from just east of Hawaii to west of the International Dateline after dropping at little at the beginning of the month has risen back to dead even so no change in the anomaly there. It is still a little over 1 degree above normal. If these trends continue it would mean the development of that Central Pacific el nino becoming the more dominant player. The big question is whether the trend continues however in region one that is a pretty steep downtrend that has developed. For you snow lovers out there this is a big moment of hope.
Now let’s look at sea surface temperature anomolies in the Pacific and specifically the northeast Pacific. The first graphic is a more hemispheric look while the second is a closeup shot of the Northeast Pacific.


Water temperatures in that area including the Gulf of Alaska remain warmer than normal. This is another positive sign for snow lovers as the player of the last 2 winters remains in place. The graphic below shows the anomalies from October of 2014. There are some startling differences from a year ago. The anomaly is actually higher now than it was a year ago! Also notice that the cold pool south the Aleutians has also shrunk considerably from a year ago.

Now I want you to look at what the sea surface temperature anomalies looked like mid January 2015 when the pattern switched into the unrelenting cold and snow for the Northeast verses today. I will lay the October 29 2015 graphic side by side.

You can see the big difference in the Pacific south of 20 degrees north which is much above normal thanks to el nino. The argument is that the warmer than normal el nino area is going to open the Pacific subtropical jet and put it into play this winter.
SIBERIA SNOW COVER INDEX

To review it it the rate of snow cover growth and not the actual snow cover that matters. The last 10 days we have seen not only huge gains in snow cover but more importantly there have been huge gains in areas south of 60 degrees North which is key. The entire southern flank is showing above normal snow cover in those areas. As of a week ago, the index was growing at above normal rate but behind the last 2 winters. We will know shortly whether the snows of the last 10 days of the month put the index near the top of the range or not but in either case it is still going to finish on the above normal side of the ledger. We are also seeing above normal snow cover growth in Eastern Canada but that area has shrunk a little (the growth not the snow cover) in the last week and this could be due to the Atlantic Oscillation turning more neutral and forecast now to go positive for a little while. I have not seen anything regarding whether Eastern Canada snow growth has a correlation to our winters. My look at the data over the last 15 years show mixed results with no clear trend.
A couple of final notes. Clearly the trend is your friend and for snow lovers these are positive signs for another harsh winter. I would just caution that these trends though they seem to be long term in nature can be undone in a hurry due to all sorts of factors too numerous to discuss on one post. The other variable in all of this is the Atlantic and what roles the Atlantic Oscillation and the North Atlantic Oscillation will play in all of this. Remember those indexes were decidedly opposite what they should have been the last 2 winters which we know didn’t really matter much. Also remember that long range is one thing and short range is quite another. The long range pattern may call for one thing but the short range has all sorts of things that come into play especailly for coastal locations which have to deal with a warm ocean at least through much of December. All of this continues to be food for thought going forward. JOESTRADAMUS is going to do something he has never done before and that is he will put out his winter outlook in the next week or so. I’m going to say upfront that long range is not my strong suit and that whatever I wind up saying, it could turn out to be quite differently than forecast. In the end I will attempt to give it a try and I will do it as objectively as a snow lover can. I know some of you won’t be satisfied unless the forecast includes dates, times, and an exact count of the number of snowflakes that fall per square mile. You folks will just have to get over that.
Be sure to download my weather app and subscribe to my local forecasts for NY NJ PA & CT. The app is free and a subscription is just 99 cents a month for an ad free secure environment
Past JOESTRADAMUS pieces on El Nino and more.
Past JOESTRADAMUS pieces on Siberia snow cover index